Visualize Content
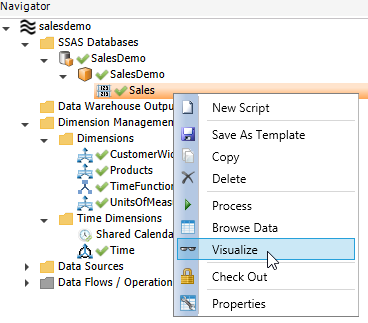
To visualize content, right click the object and click 'Visualize'.
The Solution Visualizer is a tool that gives you a graphical representation of what your Solution consists of and how everything is tied together.
The Solution Visualizer shows every element in your Solution and how it relates to other elements, such as where a Measure Group gets its data from, which Dimension Trees are used by a Measure Group, which Data Source table provides data for a dimension tree of measure group, and so forth.
Using the Solution Visualizer, you can also see how data is transformed as it moves from your Data Sources, through the various levels of the Data Warehouse and eventually ends up as source data for SSASMeasure Groups or other data consumers.
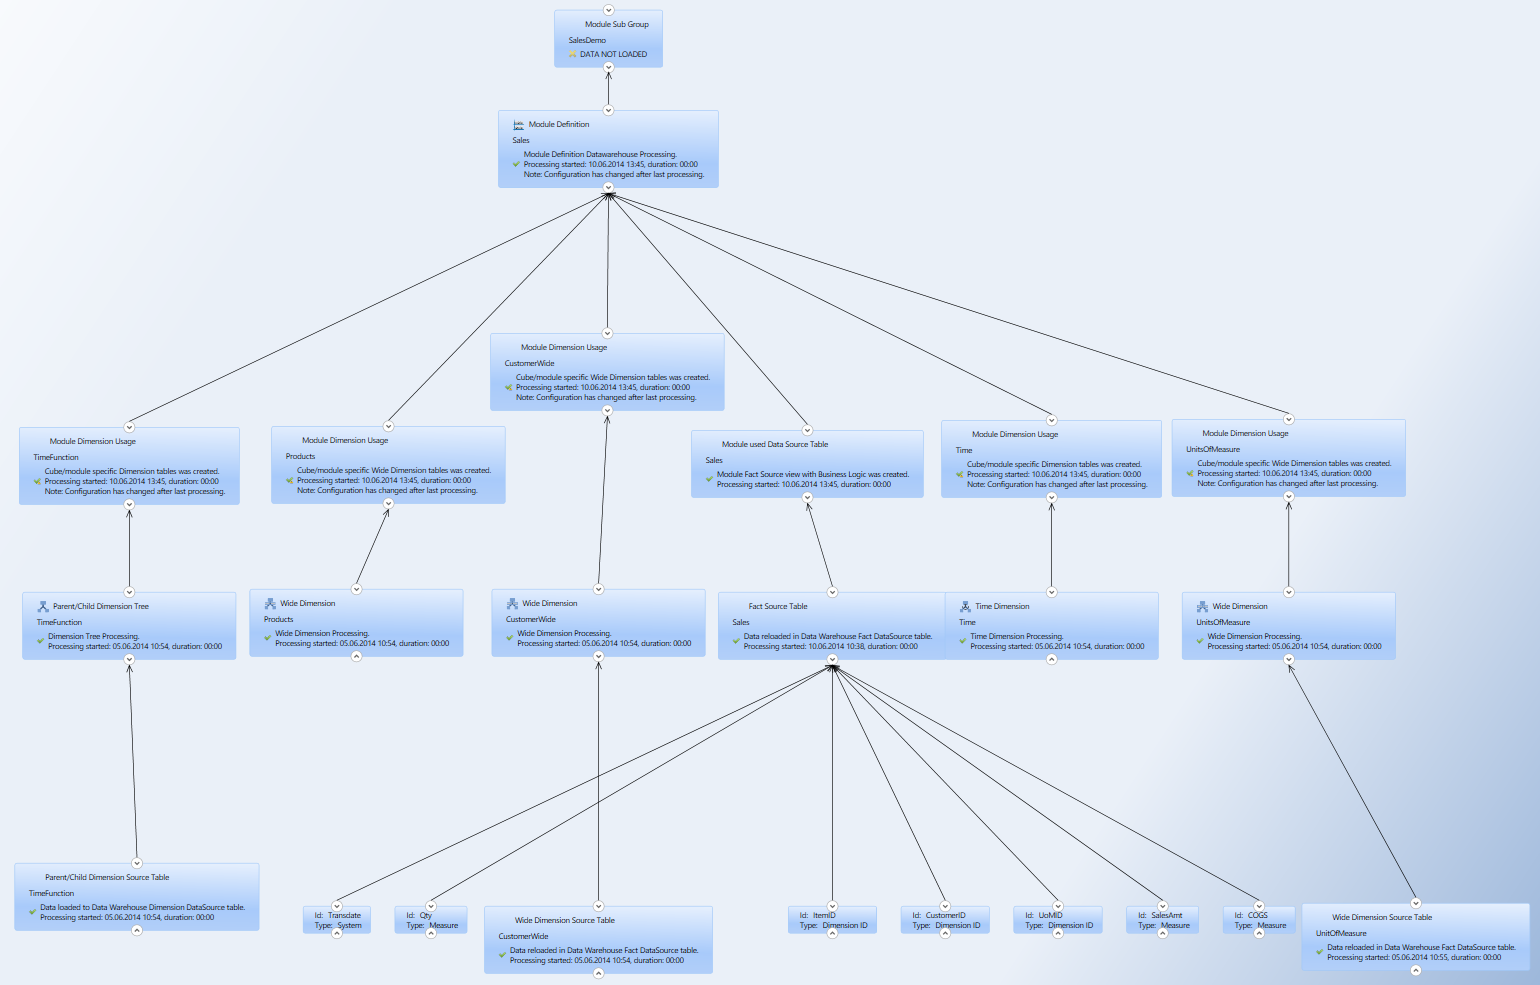
Solution Visualizer is opened in a new window. Right part of this window has a Settings section that let you zoom, use magnifier and a mini map.